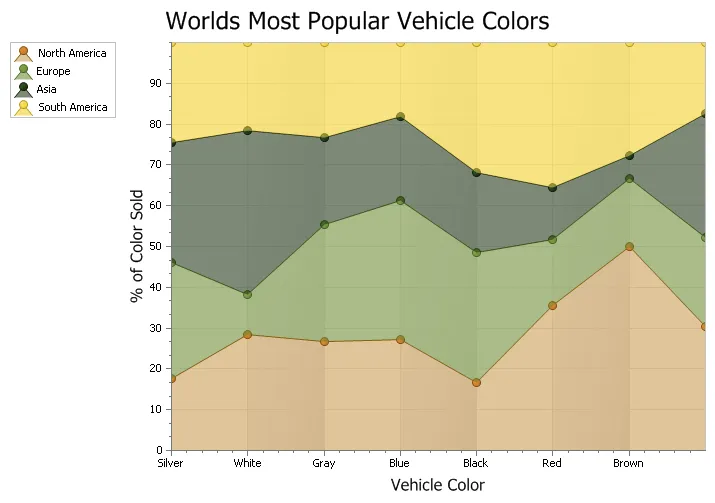
100% Stacked Area Chart
A 100% Stacked Area chart is very similar to an area chart, only the data is stacked on top of each other and the data values for each item will total 100%. Data is displayed using different colors in the "area" below the line. Each series of points is represented with a different color. Area charts are commonly used to display accumulated values over a period of time.