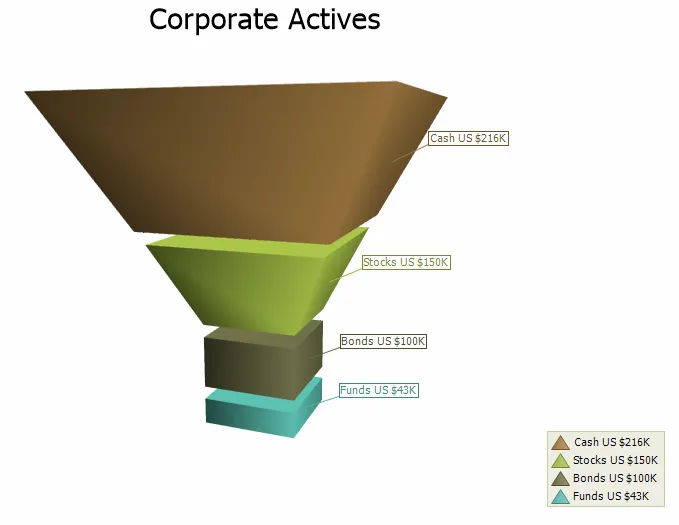
3D Funnel Chart
Just like the 2D Funnel, the 3D Funnel chart displays a series of data in a funnel shape. The top portion of the funnel will typically contain the largest percentage of the data, while the bottom will "funnel" down to the smallest percentage, however the funnel will allow data to be added in any combination to suit your needs. The size of the funnel sections are all relative to each other and the order does not matter. The number of funnel base edges is configurable, as well as it is possible to make it round. The chart can be rotated and zoomed in and out, both manually and programmatically, and a number of additional lighting, transparency and material settings are available for making truly realistic charts.
