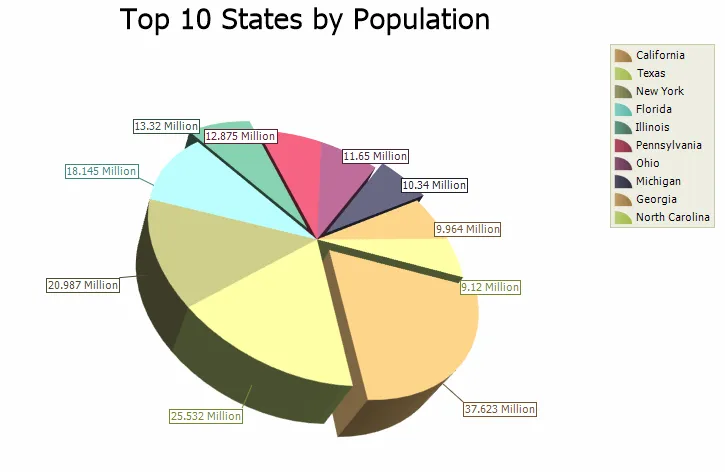
3D Pie Chart
Just like a 2D Pie chart, the 3D Pie chart displays a series of data as "slices" of a "pie". The data in the pie chart will be divided up into slices, each represents a percentage of the pie. The size of the slice will be proportional to the data it represents and each slice will be combined to represent some whole value. The chart can be rotated and zoomed in and out, both manually and programmatically, and a number of additional lighting, transparency and material settings are available for making truly realistic charts.
