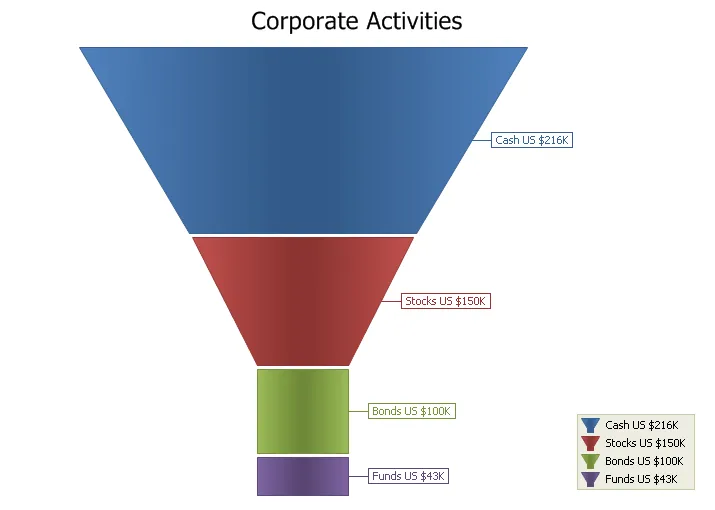
Funnel Chart
The Funnel chart displays a series of data in a funnel shape. The top portion of the funnel will typically contain the largest percentage of the data, while the bottom will "funnel" down to the smallest percentage, however the funnel will allow data to be added in any combination to suit your needs. The size of the funnel sections are all relative to each other and the order does not matter.
