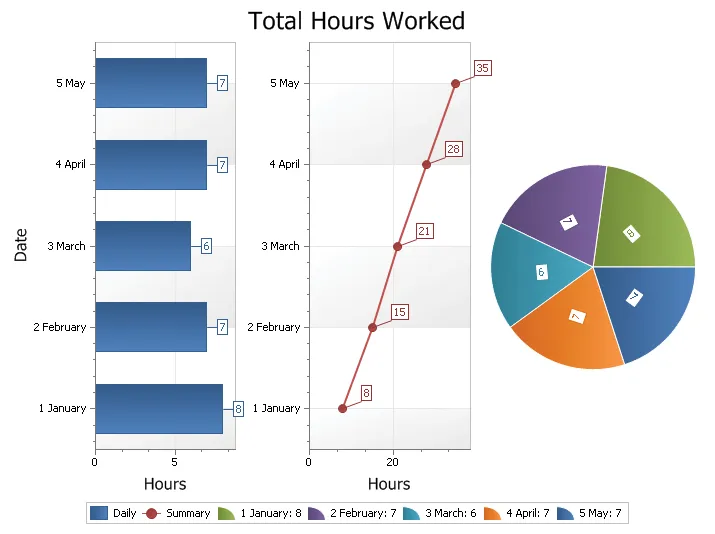
Multiple Diagram Support
Multiple Diagram Charts are charts that have multiple regions which compare similar data sets side by side (in separate panels) rather than right on top of each other. The chart by default has one diagram that you don't have to add. This is the diagram that is worked with when adding a series. The chart can however contain multiple diagrams in the same view.
