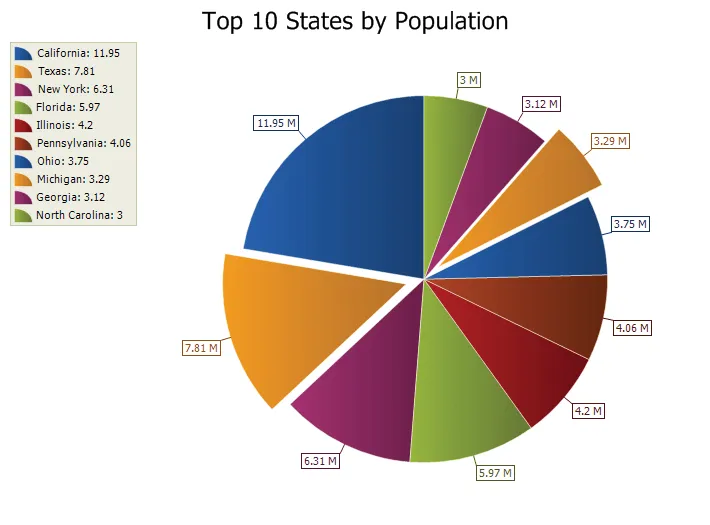
Pie Chart
A pie chart displays a series of data as "slices" of a "pie". The data in the pie chart will be divided up into slices, each represents a percentage of the pie. The size of the slice will be proportional to the data it represents and each slice will be combined to represent some whole value.
