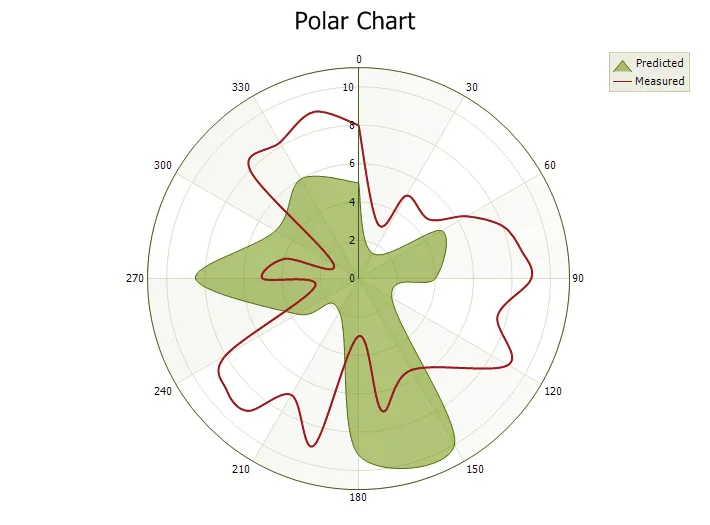
Polar Spline Chart
Polar charts use polar coordinates to plot data. The X-Axis is a circle and the values are normally fixed in degrees (0-360) or radians typical polar charts, but the chart will allow you to set any range desired. Data is plotted in terms of values and angles, where "x" is the angle/rotation and "y" is distance from the center of the circle.
