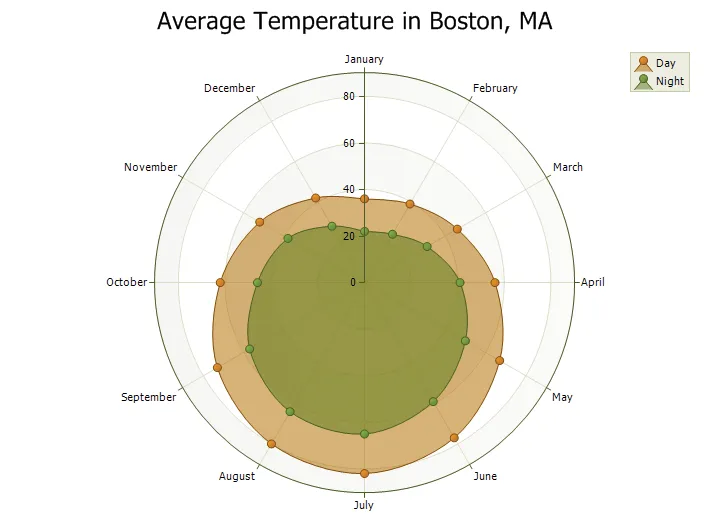
Radar Area Chart
Radar charts are basically another form of a line chart, only it is represented as a radar. Data is drawn as a line around the center of the radar. Radar charts use "poles" to display data. Each data point gets displayed on one of these poles radiating from the center.
