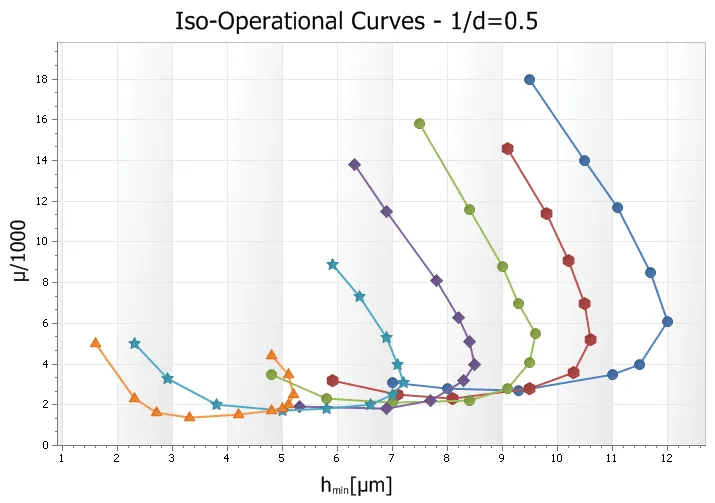
Scatter Line Chart
A Scatter chart is similar to a line chart, only the scatter chart will plot the data values in the exact order that they are entered and connect the plots with a line (unlike the line chart which will order the data based on the x and y axis). Scatter charts can be used for scientific data or can be used as a trend chart.
