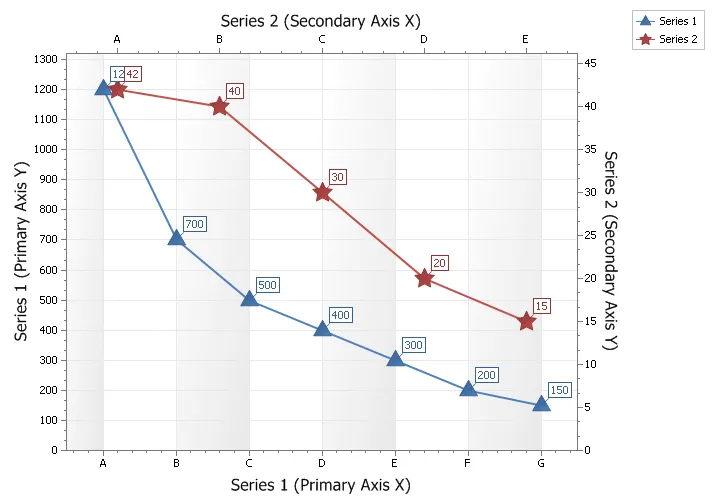
Secondary Axis Chart
Secondary axis are useful when you need to display a series of data with values that greatly differ from each other or you might use a secondary axis when displaying two series of data with different data types (i.e. price and quantity). In both of these cases you can plot each of the series on a secondary axis so that they can both be seen in the same view. Displaying both the secondary x and y axis can be useful if making a scatter chart.
