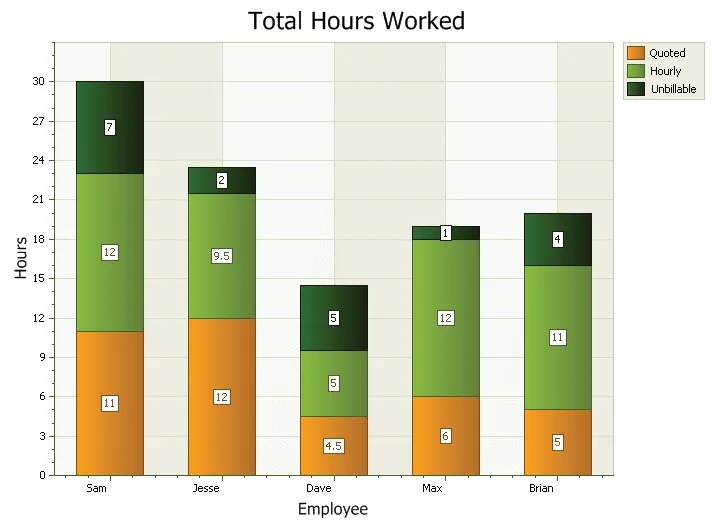
Stacked Bar Chart
A stacked bar chart is similar to a standard bar chart except the bars for a given argument will be stacked on top of each other. You can stack the bars vertically or horizontally. This type of chart is used to compare the relationship of parts to the whole. Each bar is used to represent a total. For example, you could show the number of males\females that prefer each of the 4 major sports (football, basketball, hockey, baseball) in a stacked bar chart. There would be 4 stacked bars, each divided into 2 categories (male\female).
