
Chart Sample Applications
Explore working applications that demonstrate chart types, data visualization, styling, interaction, and financial analysis with Codejock Chart.
Each download includes a compiled demo and source code you can use to review implementation patterns alongside the product documentation.
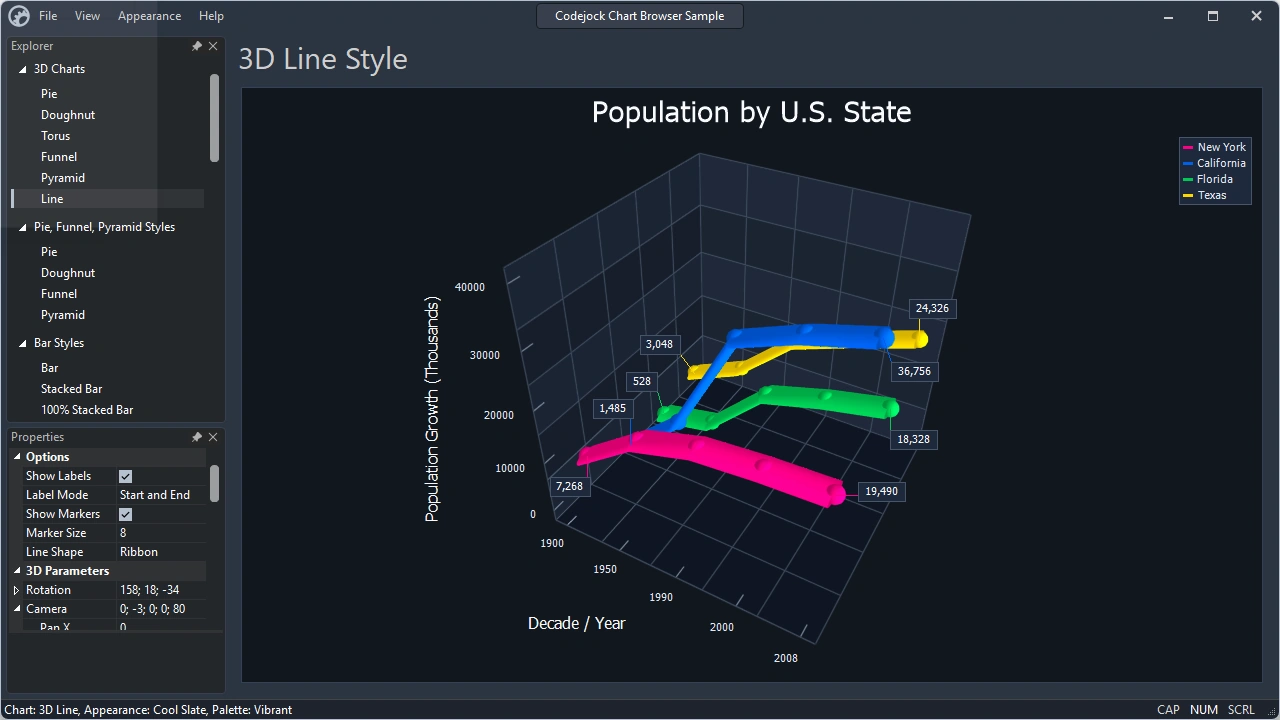
Chart Browser is a comprehensive gallery of 2D and 3D series, financial charts, multiple diagrams, secondary axes, titles, palettes, and appearance options. Interactive examples also demonstrate zooming, scrolling, rotation, lighting, and material settings.
Size: 2.66 Mb
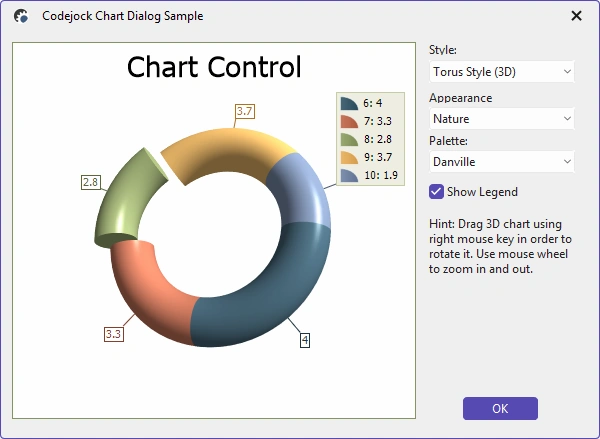
Chart Dialog demonstrates how to host Chart in a compact dialog application. Switch among common 2D and 3D series, then change the appearance, color palette, labels, and legend settings at runtime.
Size: 2.28 Mb
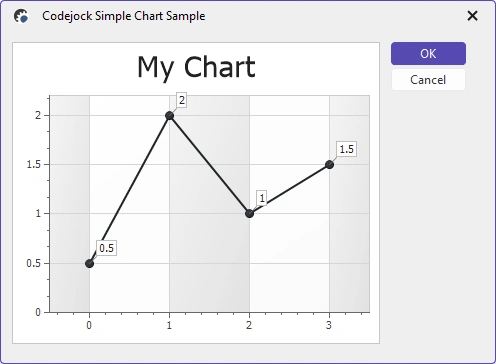
Simple Chart shows the minimum setup needed to add a Chart control, create a series, supply data points, apply a line style, and load an appearance and color palette.
Size: 2.26 Mb
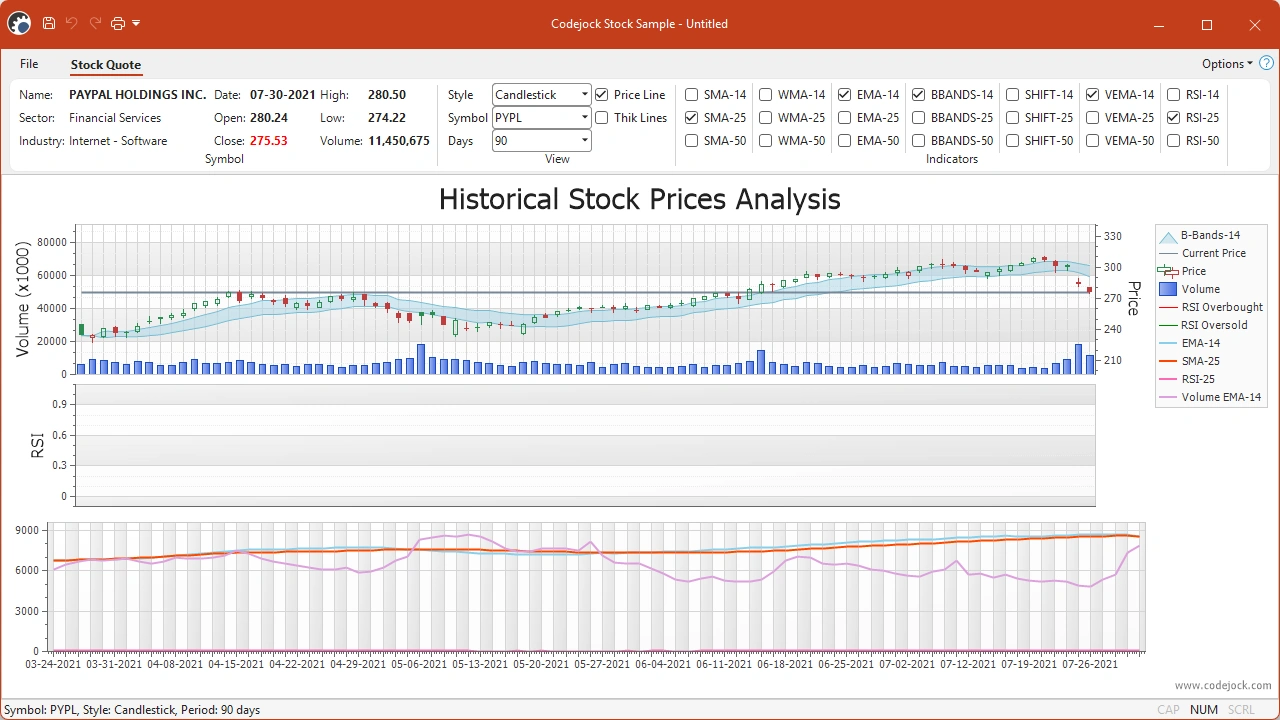
Stock Sample presents historical price and volume data with Candlestick and High-Low styles. It also demonstrates overlays and indicators such as moving averages, Bollinger Bands, price lines, and relative strength.
Size: 2.34 Mb